Willowdale Real Estate Blog

|
Blog Category
|
|
|
Blog Category
|
 Willowdale East and West historical residential market report, 2011 - 2020 This report contains two data sections (1) section one focus on the average prices (2), Section one focuses on the condo inventory, for example new listings and sold condos in a specific period. These parameters are crucial to understanding of the overall residential market. There is a 58% increase in average condominium cost in Willowdale East community in the past nine years. Despite the pandemic in 2020 the prices has continues to increase to highest level in the past nine year to Average price of $677,060. Section (1) focuses on condo prices including (a) the average sold prices in yearly bases for 2011 to 2020 (b) average selling to listing price ratio 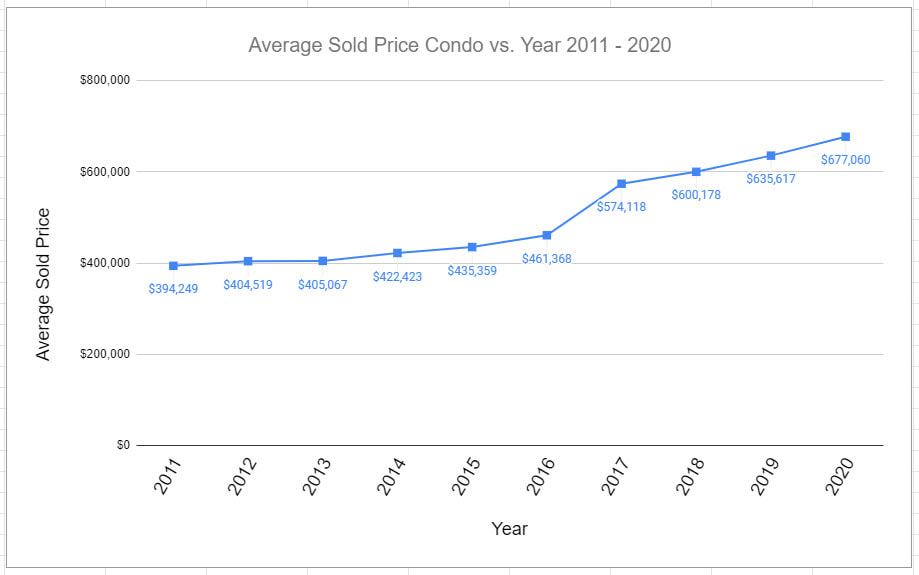 The Graph above shows the average yearly sold prices for condominiums from 2011 to 2020. The first noteworthy information is that the average price in 2020 is 58% higher than the average price in 2011, and the cost of condos has been steadily increasing for the past nine years. The most significant price jump comes from 2016 to 2017 - this is not surprising since house prices also had a considerable boost in price in the same year. 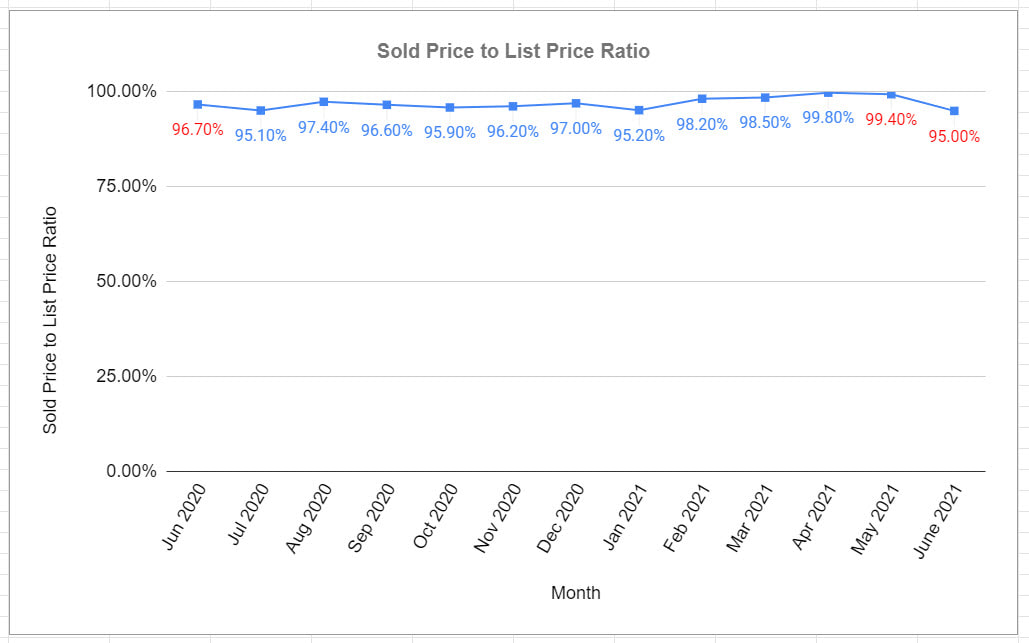 The above graph shows the selling price to listing price ration for the 2011 to 2020. Amazingly, the selling price to listing price continues close to 100% from 2011 until 2020. This result is consistent with the consistent increase of average price and a indication that market favors the sellers. Section (2) contains information regarding inventory including (a) the new residential listings yearly, (b) the sold residential yearly (c) Months of Inventory (d) days on the market 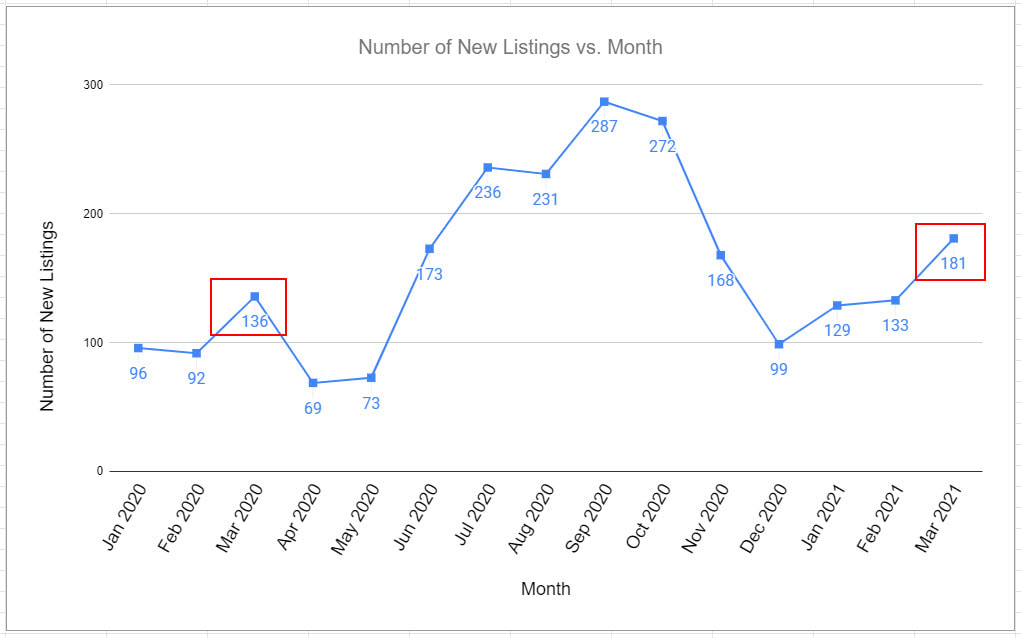 The Graph above shows the condominium listings for each year 2011 - 2020 in Willowdale East community. The new listing increases steadily from 2011 to 2015. However, new listings start to go down steadily from 2015 to 2020. The new listings in 2020 are 50% lower compared to 2012. The lower number of new listings has contributed to the continued price increase in the Willowdale community. 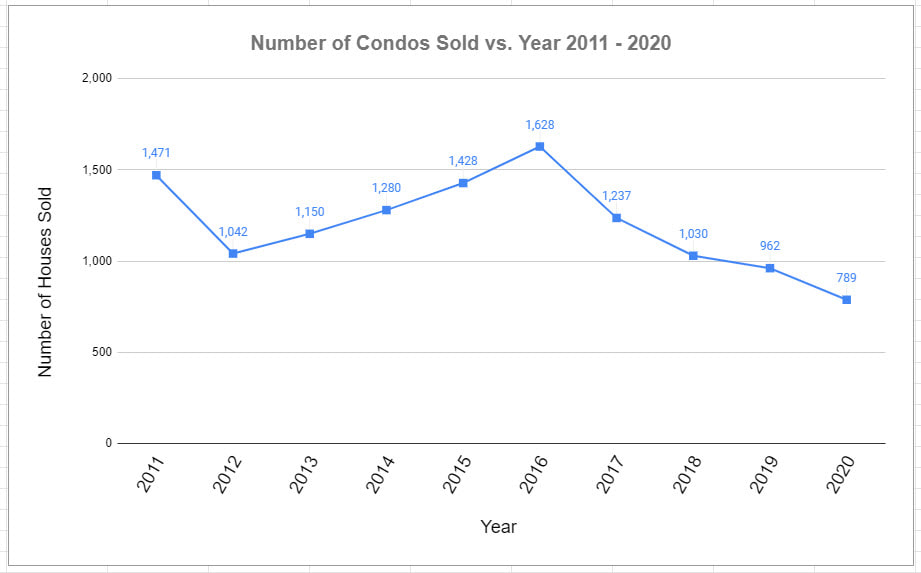 The Graph above shows the yearly sold condominiums for 2011 to 2020 in Willowdale East community. The number of condos sold drops sharply from 2011 to 2012. However, we see a steady increase in the number of condos sold from 2012 for four years until 2013. The trend changes direction, and the number of condos sold starts dropping steadily from 2016 to 2020. 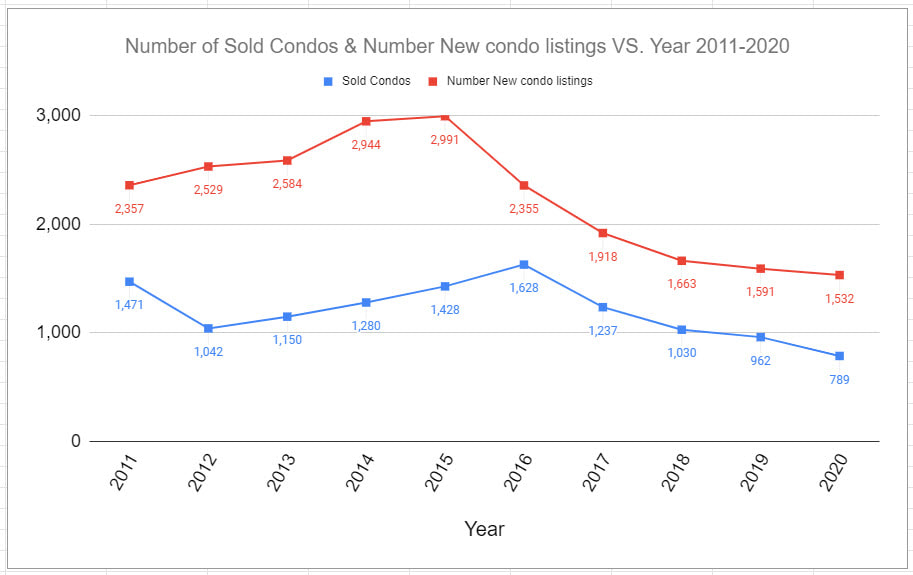 The Graph above shows the the new condo listing and sold condos within the same year from 2011 to 2020. Generally, the number of listing is twice the number of sold condos throughout the 2011 to 2020. Starting from 2016 both new listing and sold condos are reduced to the lowest level in the past nine years. 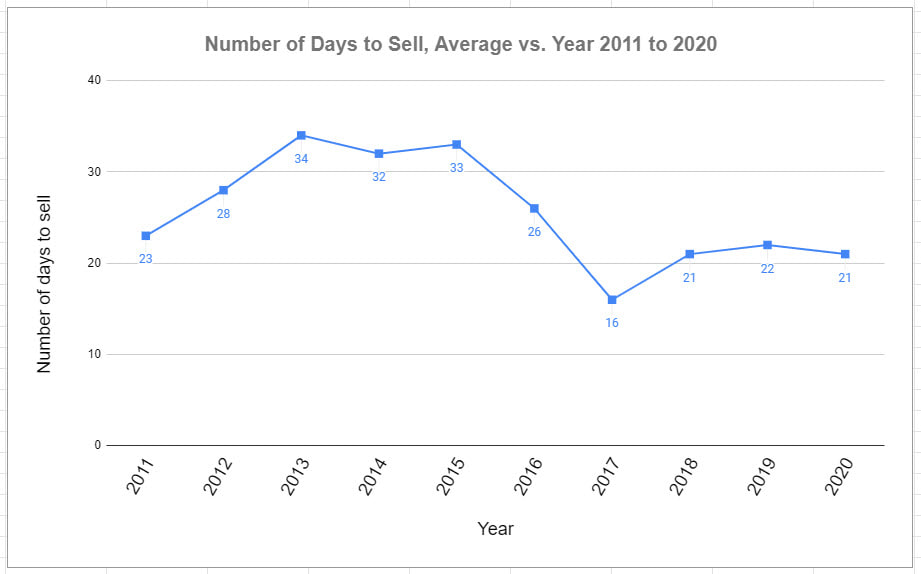 The Graph above shows the average number of days it takes to sell condominiums for 2011 to 2020. From 2011 to 2015 the time to sell condos increases from 23 to 33 days. The next two years from 2015 to 2017 it drops to lowest number of days it takes to sell condos. The number of days shows a small increase from 2017 to around 20 days and continues in that range for until 2020. Despite the pandemic in 2020 the number days to sell is around 20 indicating a continuous strong demand.
In Summary, within nine years, the condominium price has increased by an astonishing 58% in the Willowdale community. The most drastic increase was observed in 2016, 2017 and the price continued to show a substantial increase until 2020. The number of new listings has continued in a lower trend from 2016 to 2020, possibly contributing to price increase and strong seller's market. In general the number listings and sold condos have been in decline, and price of condos in the Willowdale (Yonge and Shepperd) community have been increasing in the last nine years.  AuthorThe above Real Estate article was provided by David Khosravi, a leader in his field in North York, Willowdale Real Estate, Reach out to David via email: [email protected] or by phone: 416.990.2424 Comments are closed.
|