Willowdale Real Estate Blog

|
Blog Category
|
|
|
Blog Category
|
Willowdale East, Toronto (Yonge and Sheppard), Condominium market report for February 20213/14/2021
 Willowdale East (Yonge and Sheppard) condominium market report, February 2021 This report contains two sections (1) condominium prices (2) condominium inventory. These parameters are crucial to understanding of the current condominium market. The recap of this report. The February 2021 Willowdale MLS® stats indicate an average condominium price of $717,788 and 111 new listings in the period of 28 days (February). As of today, Willowdale East condominium data shows average days on market for is 21 days. Section (1) condominium prices including (a) the average sold prices for short-term 2020 to 2021 and long-term 2017 - 2017 (b) average selling to listing price ratio 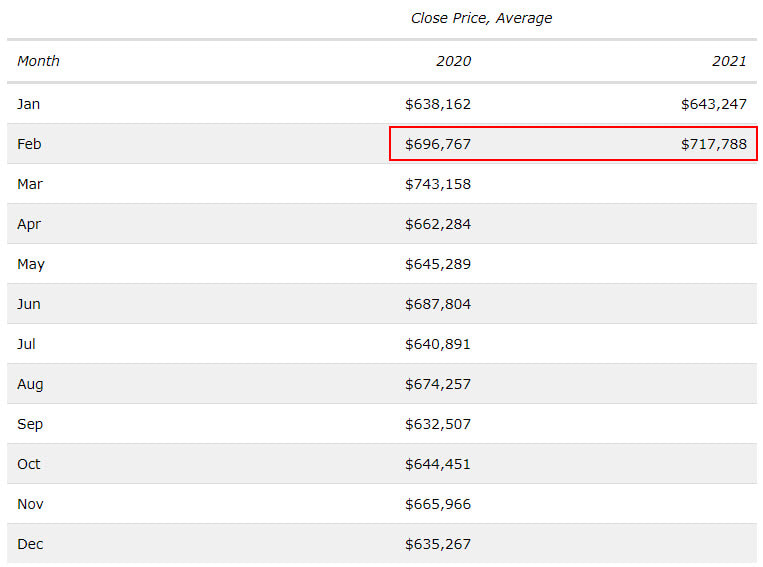 Table above shows the average sold prices for the condominium in Willowdale East community. There is an increase of 12% from Jan 2021 to Feb 2021. The increase of 12% is significant for a single month, it could be because of (1) seasonal increase in price (2) price increase in the market. We need to wait for the results of March to have a better idea. The yearly change from the Feb 2020 to Feb 2021 shows a moderate increase of 3%. 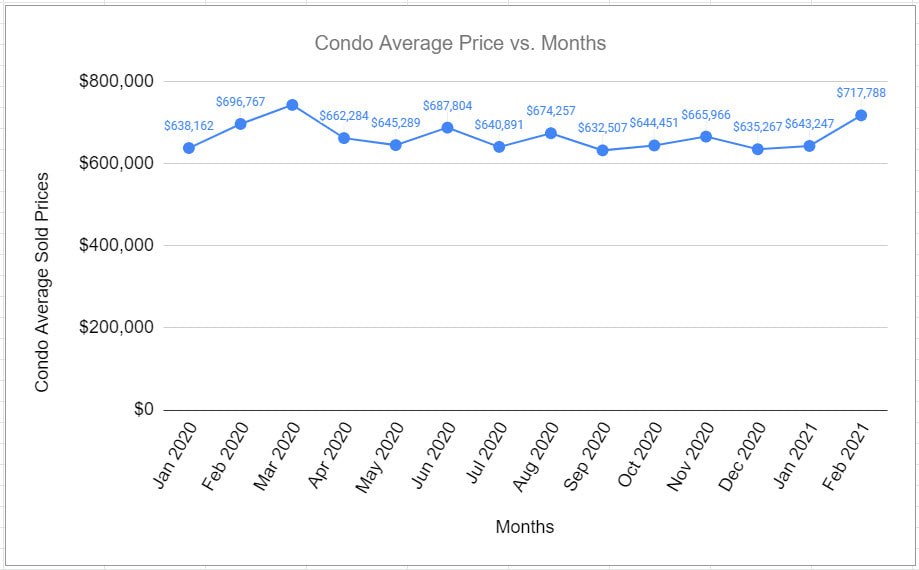 The graph above shows the average sold price for the condominium in Willowdale East community. The data is for the year 2020 and Feb 2021. There is price drop in April of 2020 most likely because of the pandemic. The price range stays the same until Feb 2021 where we see a sharp increase of 12%. 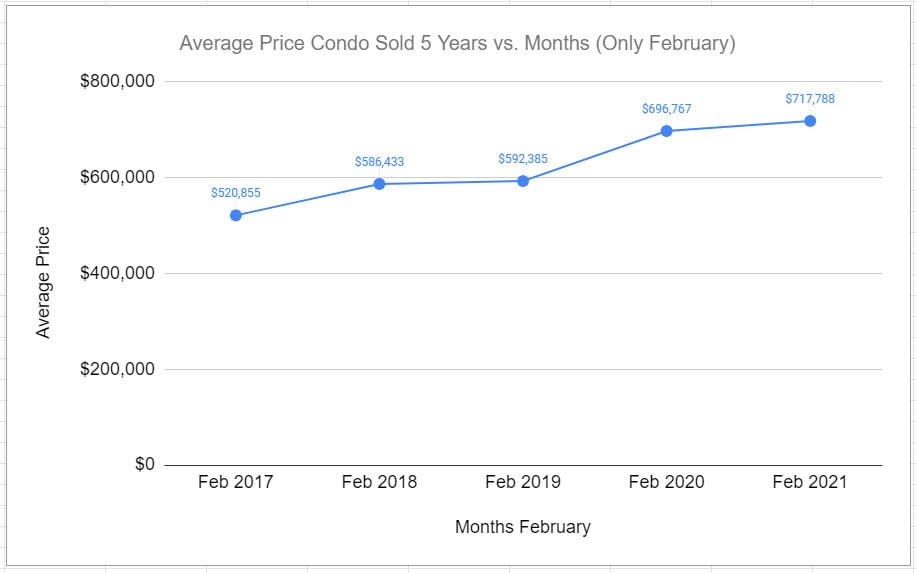 The graph above shows the average sold price for the condominium in Willowdale East community for the February of the past 5 years from 2017 to 2021. There is a clear trend in price increase from year 2017 to 2021. Despite the pandemic there is a moderate 3% increase from 2020 to 2021. 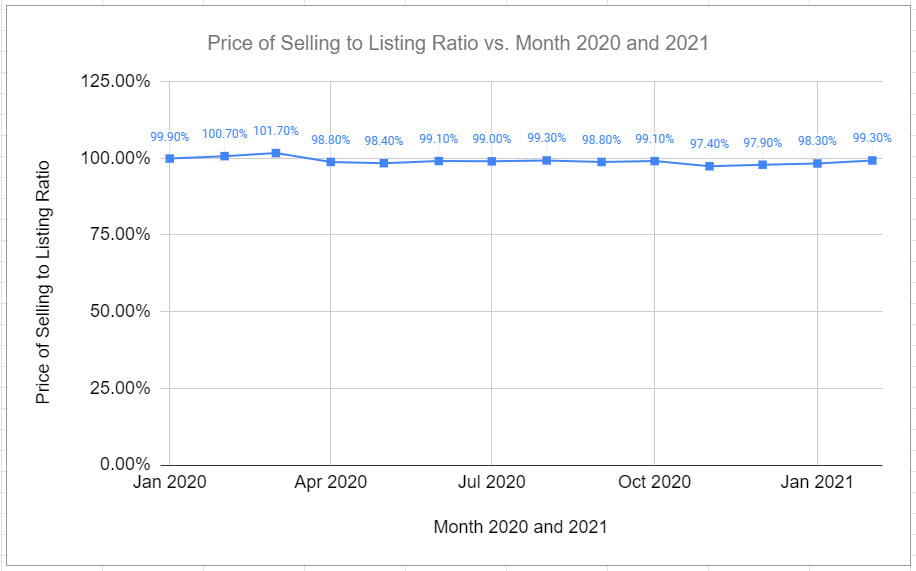 The above graph shows the selling price to listing price ration. For the last 14 month from Jan 2020 to Feb 2021 the ratio is very close to 100%. This indicates that most of the condos are priced at the market value and the demand for the condo is strong where condos are sold close to the asking price. *Understanding the average sold price Average Sold price may vary drastically in the short-term from month to month for two main reasons. (1) the mix of sold homes changes; for example, one month, more high-priced homes are sold; hence, the average sold price is skewed to a higher number. If you have more lower-priced homes are sold in one month, the average sold price will be lower for that month. (2) The change in the market condition where overall homes are sold more hence pushing the average sold price higher, or vice versa. Section (2) condominium inventory including (a) new condo listings, (b) sold condos (c) Months of Inventory (d) days on the market 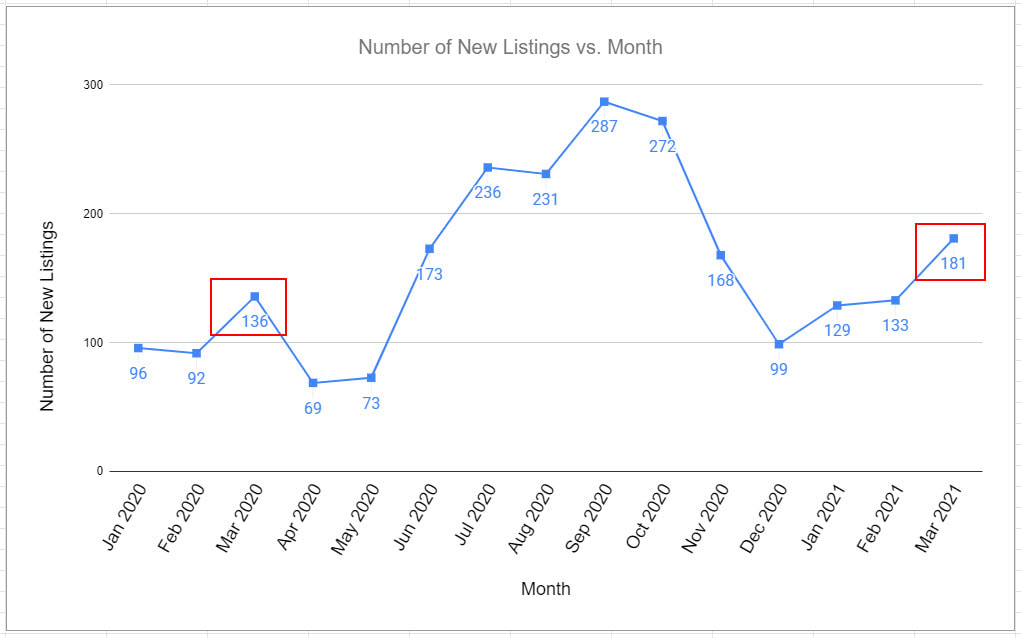 The graph above shows the new condo listings for each month of the year 2020 - 2021 in Willowdale East community. The new listing hovers around 100 each month at the beginning of the 2020 and it goes down around at the beginning of the pandemic and later it doubles in the summer and early fall. The new listings holding a normal range around 100 in Jan, Feb of 2021. 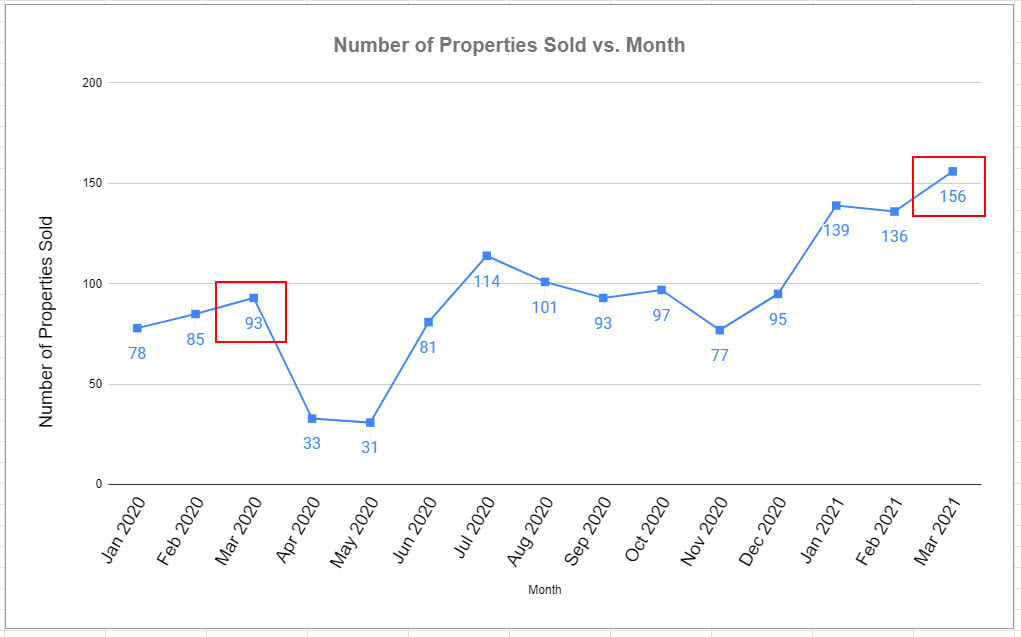 The graph above shows the sold condes for each month of the year 2020 - 2021 in Willowdale East community. The condo sells drop sharply around April and May 2020 due to the pandemic. The sells rebounds to normal levels in the summer. The condo sells seems to pick up to the highest level in the early months Jan, Feb of 2021. Summary: Condominium Inventory February 2021 New listings: 111 the total number of NEW homes listed in this period Homes sold: 115 the total number of homes with firm contract - not closed deals** Average days on market: 21 the average number of days it takes to sell a home Average selling to listing price ratio: 99.3% the ratio = average listing prices / average sold prices Months of Inventory: 1 the number months it takes to sell off all the active listing homes in the market Learn more about the Month of Inventory
Understanding this report This report is the home price and inventory for the three communities, Willowdale East, Willowdale West, and. The data provided here help you make a well-informed decision about where you'd like to live. **Why do we use firm contract numbers instead of closed deals? To obtain the most updated stats, we use the firm contract - NOT when the transaction is reported or when the deal closes. A contract is firm when both the home seller and buyer agree to the transaction. Why use periods of 28 and 56 days? We use 28 and 56 day periods because some months have more weekends, ensuring that each period has the same amount of days and weekends to make a like-for-like comparison. What does pro-rated data? It can take up to four weeks or more for transactions to be reported based on historical reporting. Almost 30% of home transactions within this period have yet to be included in this report. Hence this period's numbers are considered "pro-rated."  AuthorThe above Real Estate article was provided by David Khosravi, a leader in his field in North York, Willowdale Real Estate, Reach out to David via email: [email protected] or by phone: 416.990.2424 Comments are closed.
|