Willowdale Real Estate Blog

|
Blog Category
|
|
|
Blog Category
|
 The average Monthly condo price change JUNE 2021: Price drop of 3.54% The average Yearly price change, June 2020 to June 2021: Price Increase of 2.1% Willowdale East and West Condominium market report, JUNE 2021 This report contains two sections (1) data related to price (2) data related to inventory. The residential inventory (supply and demand) and price have a direct relationship. Hence, These parameters are crucial to understanding of the overall residential market. Brief Summary The source of data for this report is Toronto Real Estate Board, Multiple Listing Service MLS®. The data is for the period of 28 days. The average condo price is $700,200 and the median house price is $680,000. There are in total 199 new listing and the number of condos sold are 113 in Willowdale East and West. The Average days to sell a Condo is 14 days. The average Monthly condo price change JUNE 2021: Price drop of 3.54% The average Yearly price change, June 2020 to June 2021: Price Increase of 2.1% Section (1) of this report focuses on Condominium prices changes including (a) the average and median sold prices (b) average selling to listing price ratio 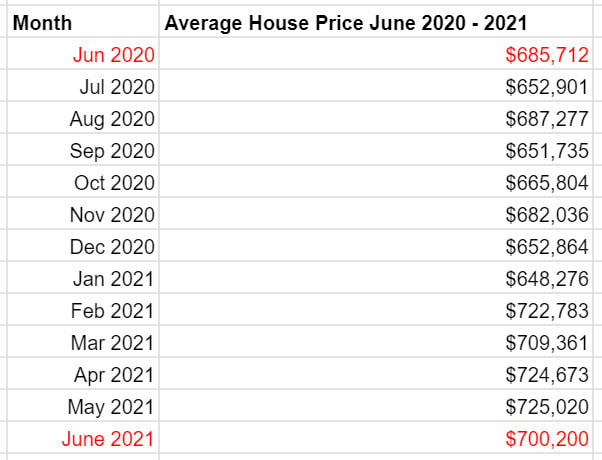 The above Table (1) shows the average sold prices for condominiums in Willowdale East and West community. There is a 3.5% decrease in Monthly average condo price sold in the June of 2021. The Yearly Average condo prices increased by 2.1% from June 2020 to June 2021. 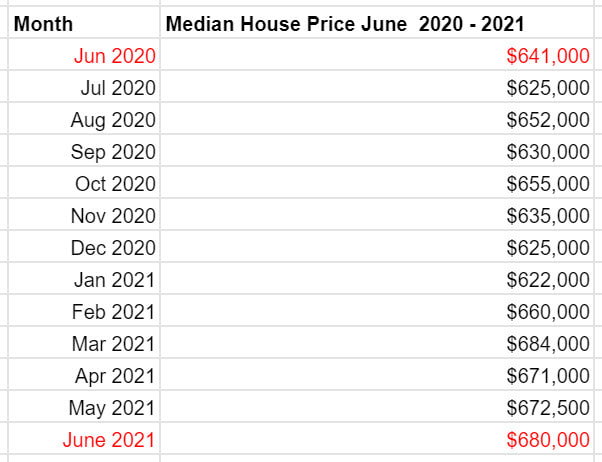 The above Table (2) shows the Median sold prices for condominiums in Willowdale East and West community. There is a difference between the median and average condo prices. It is commonly believed that median is a better reflection of price change. There is a 5.7% increase in median condo price in the last 12 months from June 2020 to June 2021. There is also a slight median price increase in June 2021. 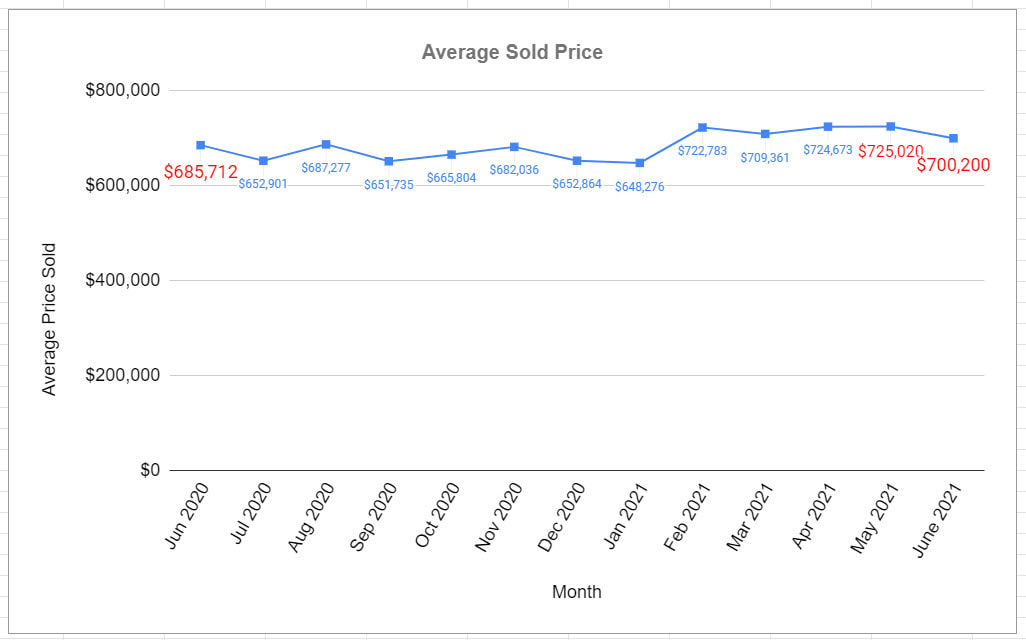 The above Graph (1) shows the average sold prices for condominiums in Willowdale East and West community. The graph shows the data presented in Table 1. A price drop of 3.5% can be seen in June 2021 from previous month. There is a yearly price increase of 2.1% compared to June 2020, 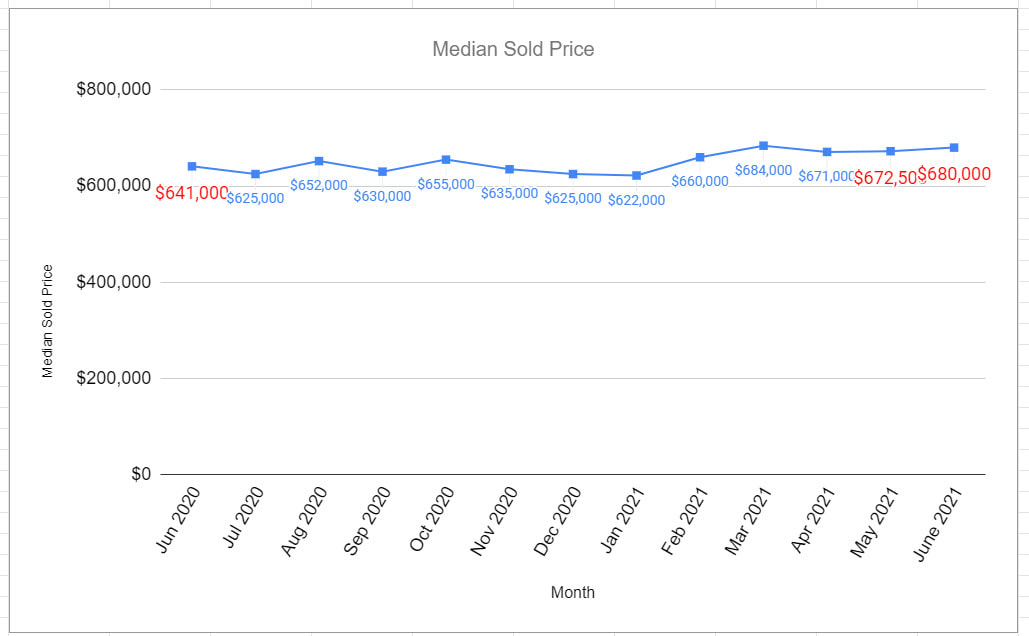 The above Graph (2) shows the median sold prices for condominiums in Willowdale East and West community. The graph shows the data presented in Table 2. The Monthly median condo prices are 1.1% higher June 2021. The Yearly median condo prices are also 5.7% higher. 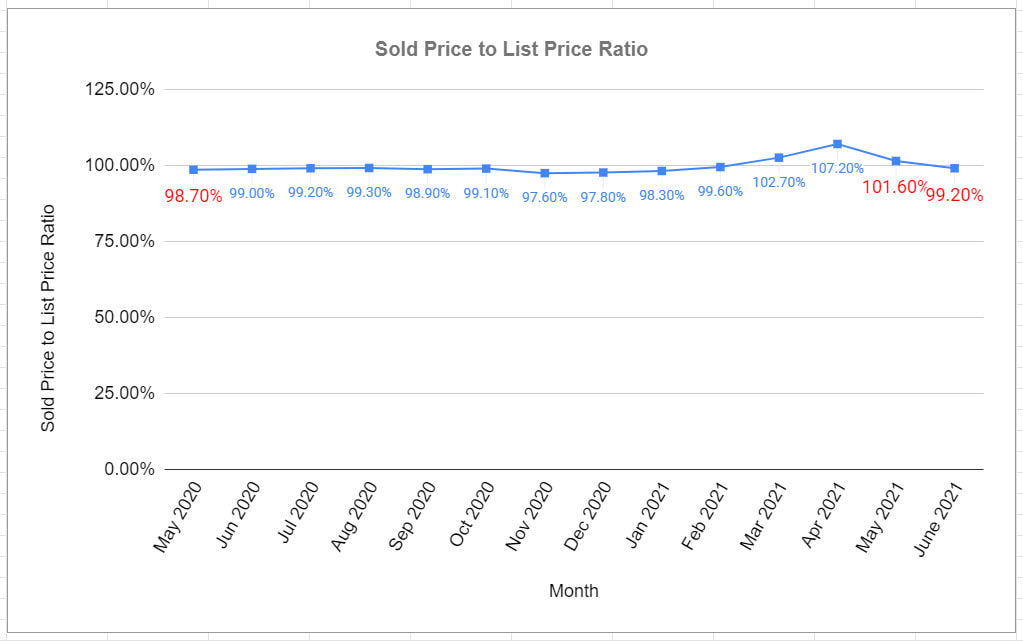 The above Graph (3) shows the sold price to listing price ratio for the last 12 months. The sold-to-list price ratio in June 2021 is 99.2%. The data shows that most of the condos on the market are priced at the market value. It also indicates demand is still strong for the condos selling primarily at the listing price. *Understanding the average sold price Average Sold price may vary drastically in the short-term from month to month for two main reasons. (1) the mix of sold homes changes; for example, one month, more high-priced homes are sold; hence, the average sold price is skewed to a higher number. If you have more lower-priced homes are sold in one month, the average sold price will be lower for that month. (2) The change in the market condition where overall homes are sold more hence pushing the average sold price higher, or vice versa. Section (2) contains information regarding inventory including (a) the new residential listings yearly, (b) the sold residential yearly (c) Months of Inventory (d) days on the market 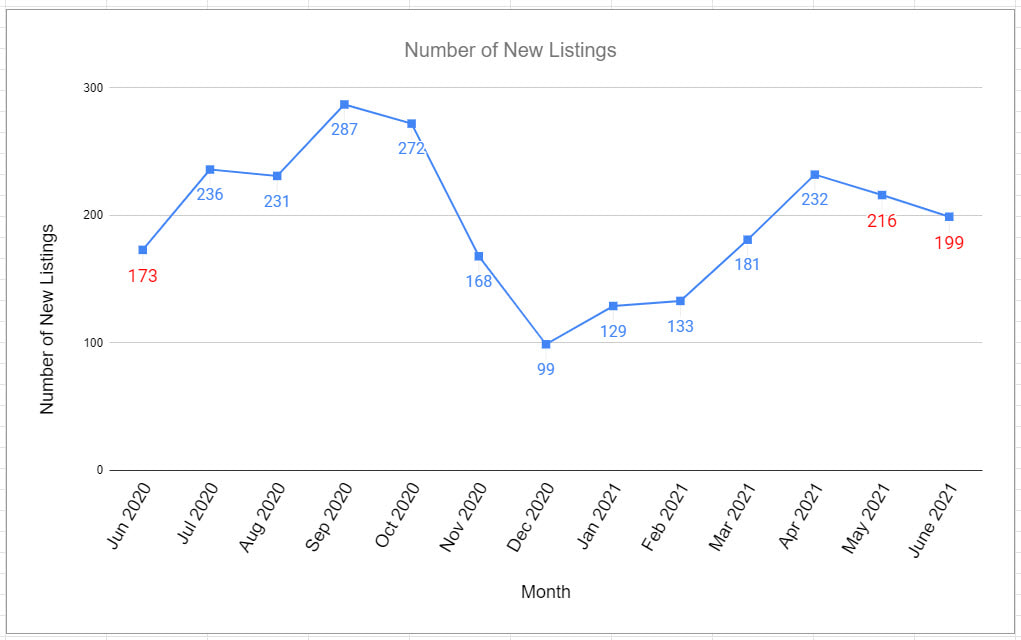 The above Graph (4) shows the new condominium listings for the past 12 months for the Willowdale East and West community. The number of new listings for June of 2021 stands at 199. The number of new listing is slightly lower compared to last month. 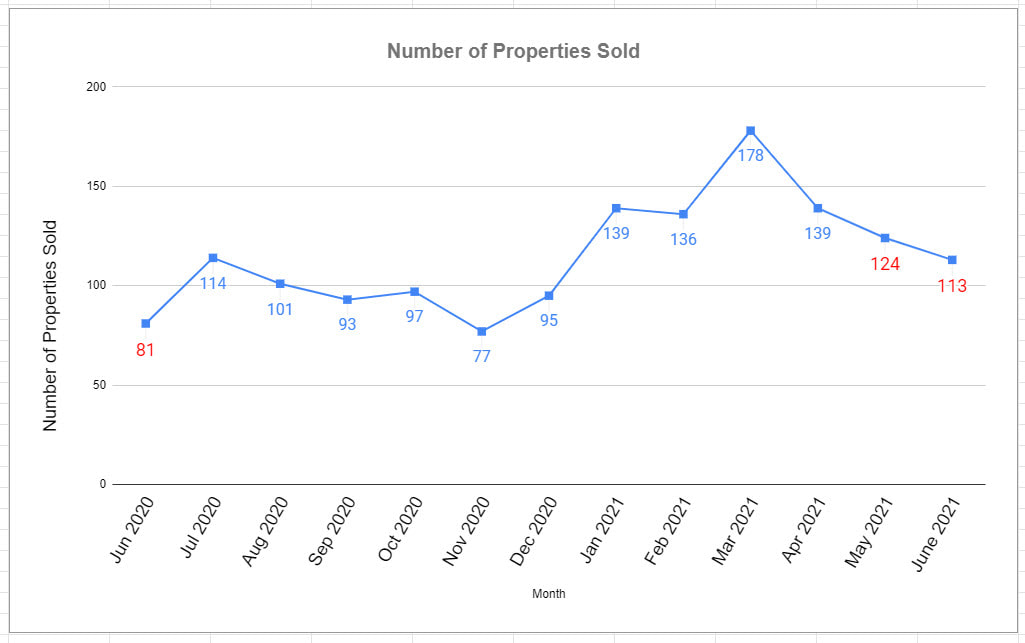 The above Graph (5) above shows the sold condos in the Willowdale East and West community for the past 12 months. The number of sold condos in June 2021 is significantly lower at 113 condos, compare to last month. 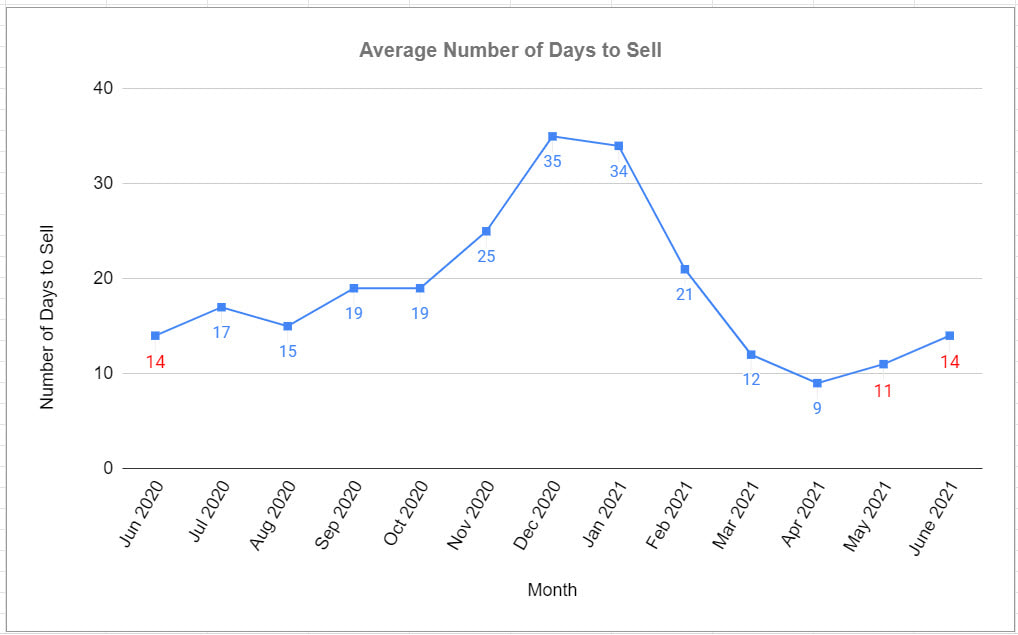 The above Graph (6) shows the average number of days to sell condos for each month for the Willowdale East and West community. On average, it takes only 14 days to sell a condo in June 2021. The average days to sell condos is still at the lowest level the past 12 months indicating that the market is hot and there is a high demand for condos in the Willowdale area.  Months of Inventory (the number of months it takes to sell off all the active listing homes in the market) The months of inventory continue to be less than 4, indicating demand is much stronger than supply. There are not enough condos in the market to offset the demand. Hence, sellers are still enjoying the strong market, referred to as Seller's Market. The strong demand and lower supply are still driving the prices higher. Learn more about the Month of Inventory Understanding this report This report is the home price and inventory for the three communities, Willowdale East, Willowdale West, and. The data provided here help you make a well-informed decision about where you'd like to live. **Why do we use firm contract numbers instead of closed deals? To obtain the most updated stats, we use the firm contract - NOT when the transaction is reported or when the deal closes. A contract is firm when both the home seller and buyer agree to the transaction. Why use periods of 28 and 56 days? We use 28 and 56 day periods because some months have more weekends, ensuring that each period has the same amount of days and weekends to make a like-for-like comparison. What does pro-rated data? It can take up to four weeks or more for transactions to be reported based on historical reporting. Almost 30% of home transactions within this period have yet to be included in this report. Hence this period's numbers are considered "pro-rated."  AuthorAuthor The above Real Estate article was provided by David Khosravi, a leader in his field in North York, Willowdale Real Estate, Reach out to David via email: [email protected] or by phone: 416.990.2424 Comments are closed.
|