Willowdale Real Estate Blog

|
Blog Category
|
|
|
Blog Category
|
 Willowdale East and West historical residential market report, 2011 - 2020 This report contains two sections (1) residential prices (2) residential inventory. These parameters are crucial to understanding of the overall residential market. Section (1) focuses on residential prices including (a) the average sold prices in yearly bases for 2011 to 2020 (b) average selling to listing price ratio 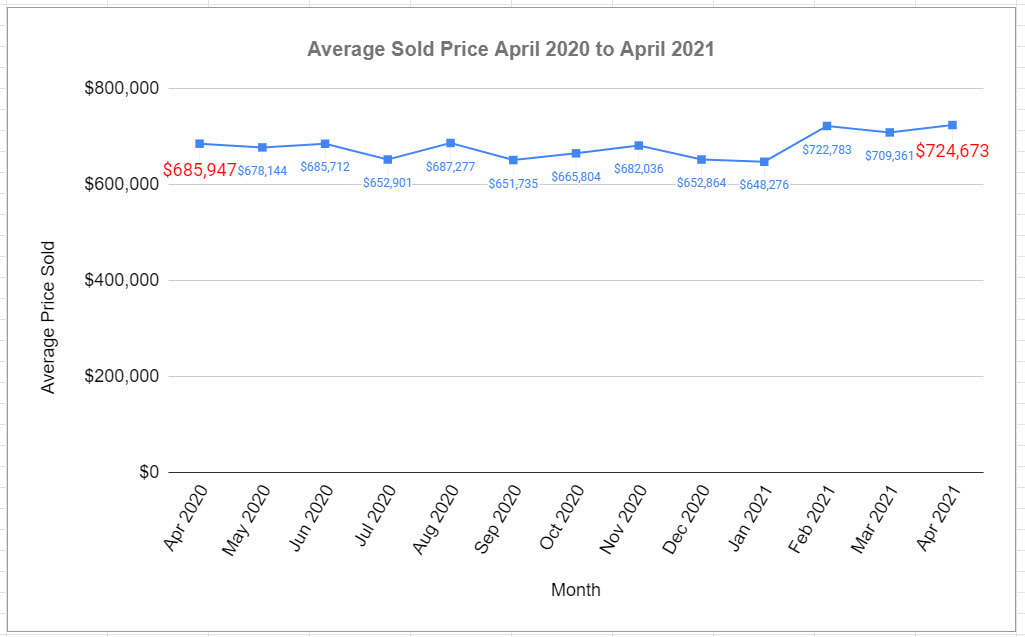 The Graph above shows the average yearly sold prices for the residential properties from 2011 to 2020. The first striking information is the average price in 2020 is almost double the average price in 2011 - within 9 years residential properties have double in price in Willowdale community. The price increase is gradual from 2011 to 2015 and a drastic increase from 2015 to 2017. The average price is highest in 2017 with a drop in prices 2018. Finally from 2018 to 2020 prices are relatively stable. 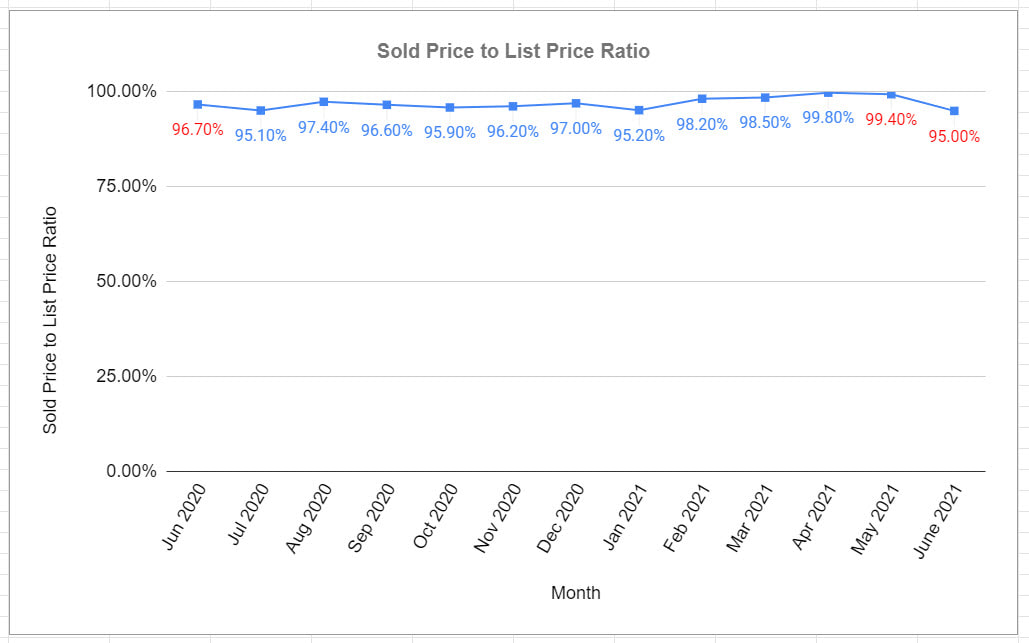 The above graph shows the selling price to listing price ration for the 2011 to 2020. Amazingly, the selling price to listing price continues close to 100% from 2011 until 2017. We see a mild drop in the ration only after 2017. This result is consistent with the consistent increase of average price and a indication that market favors the sellers. Section (2) contains information regarding inventory including (a) the new residential listings yearly, (b) the sold residential yearly (c) Months of Inventory (d) days on the market 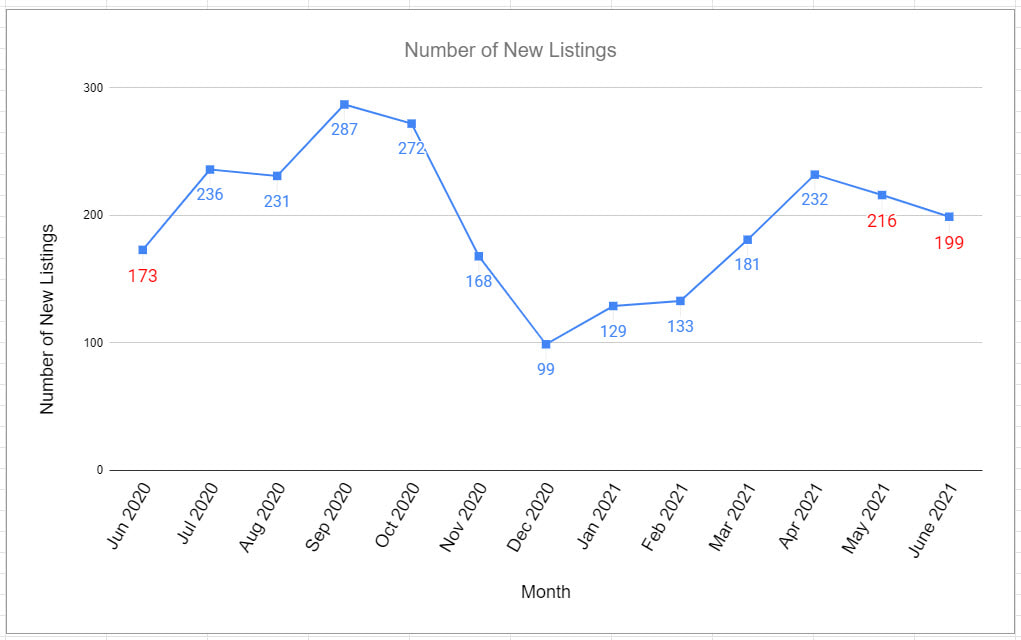 The graph above shows the new residential listings for each year 2011 - 2020 in Willowdale East and West community. The new listing increase sharply to 900 from 2011 to 2012 and continued stay around 900 listings. Starting 2016 active listings dropped to around 800 yearly until 2020. We see a sharp drop in listing in 2020 perhaps due to the pandemic. Th lower number of new listings have contributed to the continues price increase in the Willowdale community. 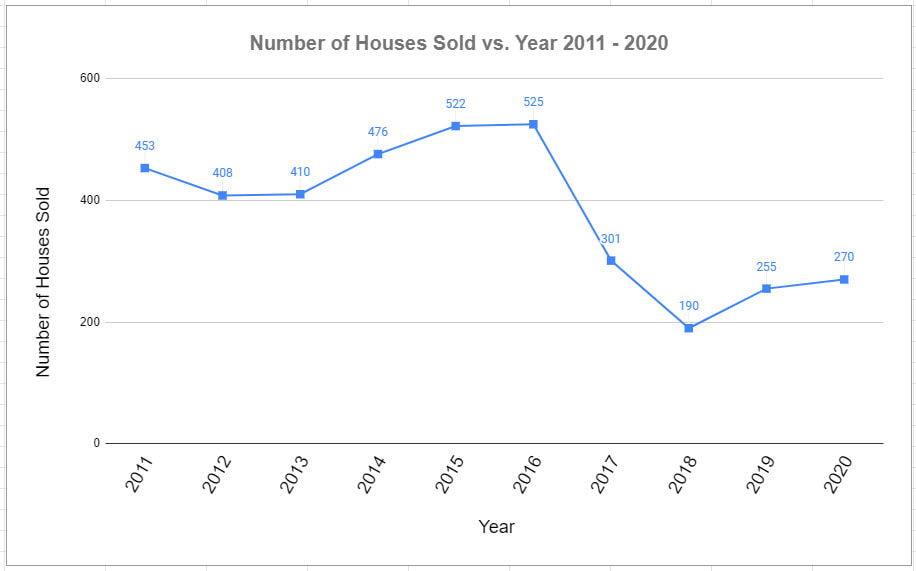 The graph above shows the yearly sold residential homes for 2011 to 2020 in Willowdale East and community. The condo sells drop sharply around April and May 2020 due to the pandemic. The sells rebounds to normal levels in the summer. The condo sells seems to pick up to the highest level in the early months Jan, Feb of 2021. 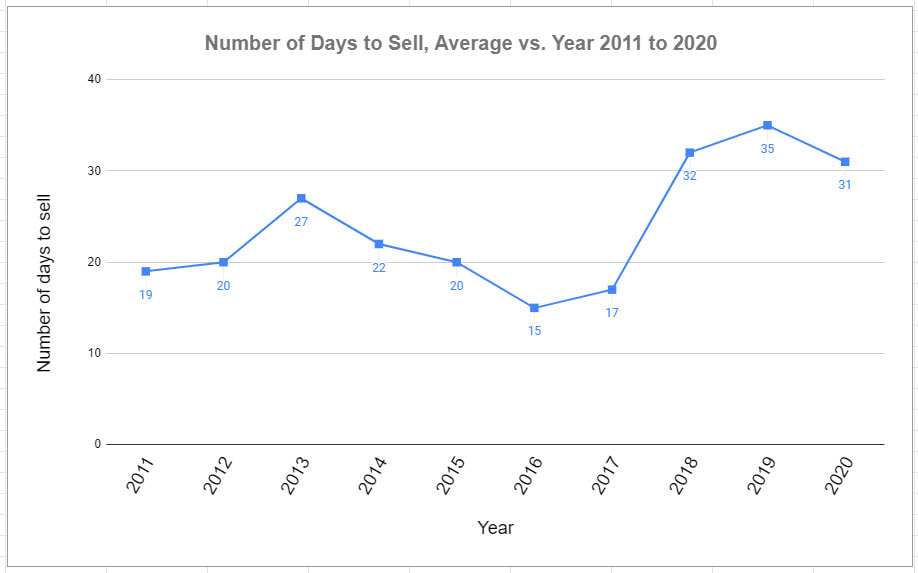 The Graph above shows the average number of days it takes to sell houses for 2011 to 2020. From 2011 to 2015 the fluctuations are small until 2015 and 2016 when we see a drastic drop in the number of days to sell. The smaller number of days to sell shows the strong sellers market for the 2016 and 2017. From 2018 to 2020, the average days to sell drops to the lowest in 9 years to around 30 days however, 30 days is not particularly long time and indicating that the sellers market continues.
In Summary, within 9 years the price of residential homes have double in the Willowdale community. The most drastic increase was observed in 2016 and 2017 - perhaps such an increase was not sustainable for such a short period of time. From 2017 to 2020 the price increase has been moderate but continues. From 2017 to 2020 both number of new listing and the number of sold properties are lower the previous years. Willowdale community is a diverse community with stronger presence of Chines, Korean, and Persians in the community. The Willowdale community has been evolving for the past 20 years to be one of the prestigious neighborhoods in Toronto.  AuthorThe above Real Estate article was provided by David Khosravi, a leader in his field in North York, Willowdale Real Estate, Reach out to David via email: [email protected] or by phone: 416.990.2424 Comments are closed.
|