Willowdale Real Estate Blog

|
Blog Category
|
|
|
Blog Category
|
 Willowdale Ontario real estate market trend report - February 2021 Residential freehold Willowdale real estate market trends Communities: Willowdale East, Willowdale West Willowdale Housing Market Report for February 2021 The February 2021 Willowdale MLS® stats indicate an average house price of $2,235,167 and 53 new listings in the last 28 days. As of today, Willowdale housing data shows median days on market for a home is 25 days. Housing Prices February 2021 for 28 days *Average sold price: $2,066,234 Monthly change in price January to February: 0.76% Increase February 2020 to February 2021: Moderate increase 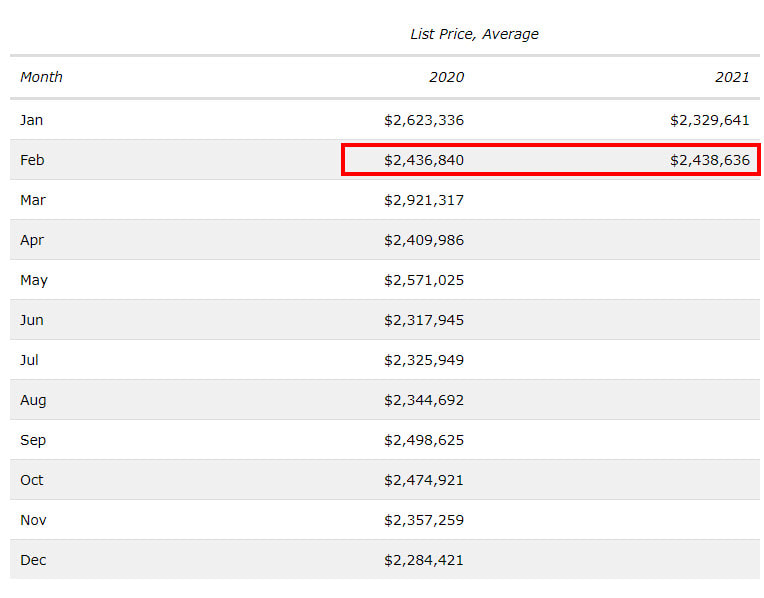 Average list price for Willowdale area year 2020 to 2021 The table above shows the monthly comparison for February 2020 and February 2021 shows no significant change 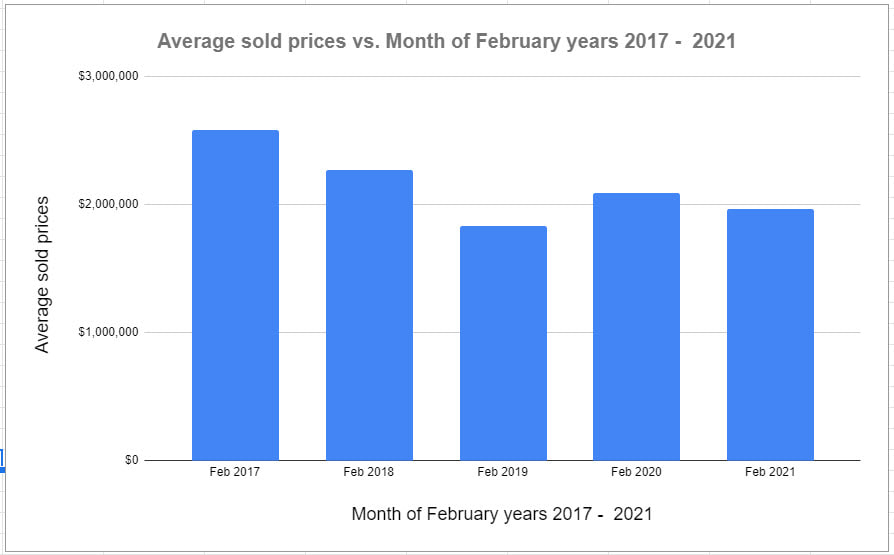 The Graph above shows that the average sold prices of residential homes is the highest in the Feb 2017, over 2.5 M dollars. The average prices have been dropping since Feb 2017. This year, Feb 2021, Average sold prices is just below 2 M dollars. *Understanding the average sold price Average Sold price may vary drastically in the short-term from month to month for two main reasons. (1) the mix of sold homes changes; for example, one month, more high-priced homes are sold; hence, the average sold price is skewed to a higher number. If you have more lower-priced homes are sold in one month, the average sold price will be lower for that month. (2) The change in the market condition where overall homes are sold more hence pushing the average sold price higher, or vice versa. Housing Inventory New listings: 53 the total number of NEW homes listed in this period Homes sold: 29 the total number of homes with firm contract - not closed deals** Average days on market: 21 the average number of days it takes to sell a home Average selling to listing price ratio: 99.1% the ratio = average listing prices / average sold prices Months of Inventory: 1 the number months it takes to sell off all the active listing homes in the market Learn more about the Month of Inventory
Understanding this report This report is the home price and inventory for the three communities, Willowdale East, Willowdale West, and Newtonbrook. The data provided here help you make a well-informed decision about where you'd like to live. **Why do we use firm contract numbers instead of closed deals? To obtain the most updated stats, we use the firm contract - NOT when the transaction is reported or when the deal closes. A contract is firm when both the home seller and buyer agree to the transaction. Why use periods of 28 and 56 days? We use 28 and 56 day periods because some months have more weekends, ensuring that each period has the same amount of days and weekends to make a like-for-like comparison. What does pro-rated data? It can take up to four weeks or more for transactions to be reported based on historical reporting. Almost 30% of home transactions within this period have yet to be included in this report. Hence this period's numbers are considered "pro-rated." Market report January 2021 Willowdale, Toronto real estate market report for January 2021, 13% increase from January of 2020  AuthorThe above Real Estate article was provided by David Khosravi, a leader in his field in North York, Willowdale Real Estate, Reach out to David via email: [email protected] or by phone: 416.990.2424 Comments are closed.
|